The meaning of China’s gold announcement and the new dollar

“official gold reserves”: what you see is not all there is to it…

DESIGNS
As far as the new dollar is concerned:

A revaluation of the dollar via introduction of a new dollar will have the effect of making debt easier to pay. There might also be a restructuring of terms of existing debt that would accompany this change. Introducing a new version of the currency would provide the political cover to change the terms of existing debt without it having the appearance of a default (you and I would know the truth as would most of the creditors but from the standpoint of the common man on the street most would be oblivious).

The reason why the government would bid for gold is mainly for the major creditors. You would have to put yourself in the position of a major central bank or a old-moneyed family to understand why this is the case, but I will try to explain it here.

If the current status quo world most of the wealthy count their wealth in terms of credit denominated in fiat money. In the event of a default most of this credit based value will evaporate and so most of the wealth of the super rich will also evaporate. Suppose you are a major wealth holder (and these people, like it or not, do pull the strings). You would like to stay on top wealth wise. What do you use to maintain your wealth in the event of a credit write-down? Well, you use items that can be valued arbitrarily high without impacting the major world economy. The items that fit the bill are very high end collectibles, prime real estate, and gold. All of these items have value derived in the mind that are independent of their value in use. This is why the super rich families own these items.

The central banks don’t own the collectibles and real estate, but they do own gold. So if credit can be written down while gold is revalued simultaneously it will keep the super wealthy whole. In other words, it will put 100% of the burden of the credit revaluation on the upper middle class and lower upper class. From the standpoint of the major world power brokers this is a desirable thing. They get to keep their wealth while avoiding the pitchforks 🙂 Make sense?
https://www.youtube.com/watch?v=iQ86ztOLChQ&lc=z12fhpub4p2vxbtre04chdmojliag3zycso0k

Solar Wind Decrease, 2nd Confirmation of 2030 Mini Ice Age | Mini Ice Age 2015-2035

The model forecasts that the existing cycle, 24, will end in 2018. The next cycle, 25, could prove to be very interesting, as the model predicts it will be difficult to tell when it ends and the next one begins. The duration of cycle 25 will be either 10.5 or 15 yr long. The model forecasts that a pronounced grand solar minimum will persist from the start of cycle 25 in 2018 out to 2060. The 100 yr, multi-cycle prediction, which shows a small rise then a further decline in cycle magnitude, suggests the minimum may extend beyond 2060. The forecast for a grand minimum in this time period is consistent with the predictions of Mörner (2011), Scafetta (2012), (2013) and Cionco and Compagnucci (2012).

R. J. Salvador, A mathematical model of the sunspot cycle for the past 1000 yr, Pattern Recogn. Phys., 1, 117–122, 2013

The beginning of the last glacial period was characterized in the Northern hemisphere by major accumulation of snow at high latitudes and the formation of a huge polar ice sheet. For climatologists this was paradoxical, since snowfall is always associated with high humidity and relatively moderate temperatures. Now, a French team…has solved this paradox…during this period water temperatures in the Bay of Biscay remained relatively high, whereas temperatures in mainland Europe gradually fell. Carried northwards by wind, the humidity released by this thermal contrast appears to have caused the snowfall that formed the polar ice sheet.

María-Fernanda Sánchez-Goñi, Edouard Bard, Amaelle Landais, Linda Rossignol, Francesco d’Errico, Air-sea temperature decoupling in Western Europe during the last interglacial/glacial transition, Nature Geoscience, 1 September 2013.

Chinese gold and the U.S. dollar

110813-1

  • China’s central bank is buying huge quantities of gold.
  • China wants the yuan to become a reserve currency, but does not want a “strong yuan”.
  • China wants the leverage to control all currency values, which requires control of the gold market.[…]

Once China has enough gold, it will bid up the yuan-denominated price into the stratosphere. Once it does that, there are only three choices. First, maintain credibility and the reserve currency status by refusing to change the price of US dollar denominated gold. If it does that, domestic industries will be crippled by Chinese competition, because the yuan will become very cheap in relation to the dollar. Second, allow the dollar denominated price of gold to skyrocket in synch with the yuan denominated price. That will end the US dollar’s reserve currency status. Third, kow-tow to Beijing, seeking a seal of approval from China for any serious financial maneuvers.

None of America’s choices are good ones. At this point, no matter what the USA does, China wins.

http://seekingalpha.com/article/3178896-the-real-reason-china-is-buying-up-the-worlds-gold

Climate change – facts and fictions

wood4trees-2015

global temperatures

icecover_current_new
The Earth has always warmed and cooled.

The climate is complex and we do not understand it.

We know too little, based on a sample of just a few decades of empirical observations.

Over the past 165 years we had a warming of 0.76°C (+0.05 C per decade). It is far from unprecedented and far from alarming.

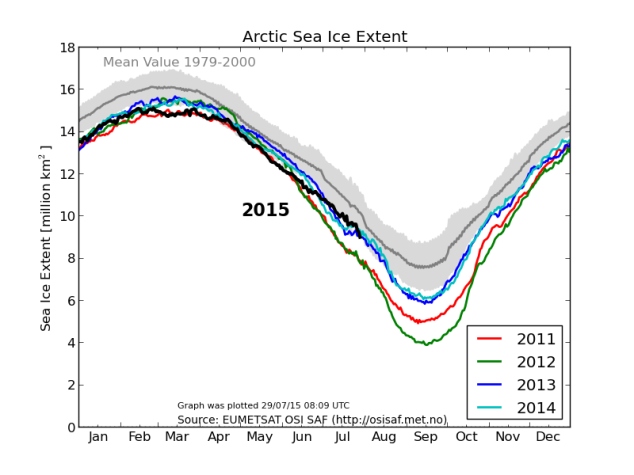
There has been a significant rebound of the Arctic ice cap since 2012.

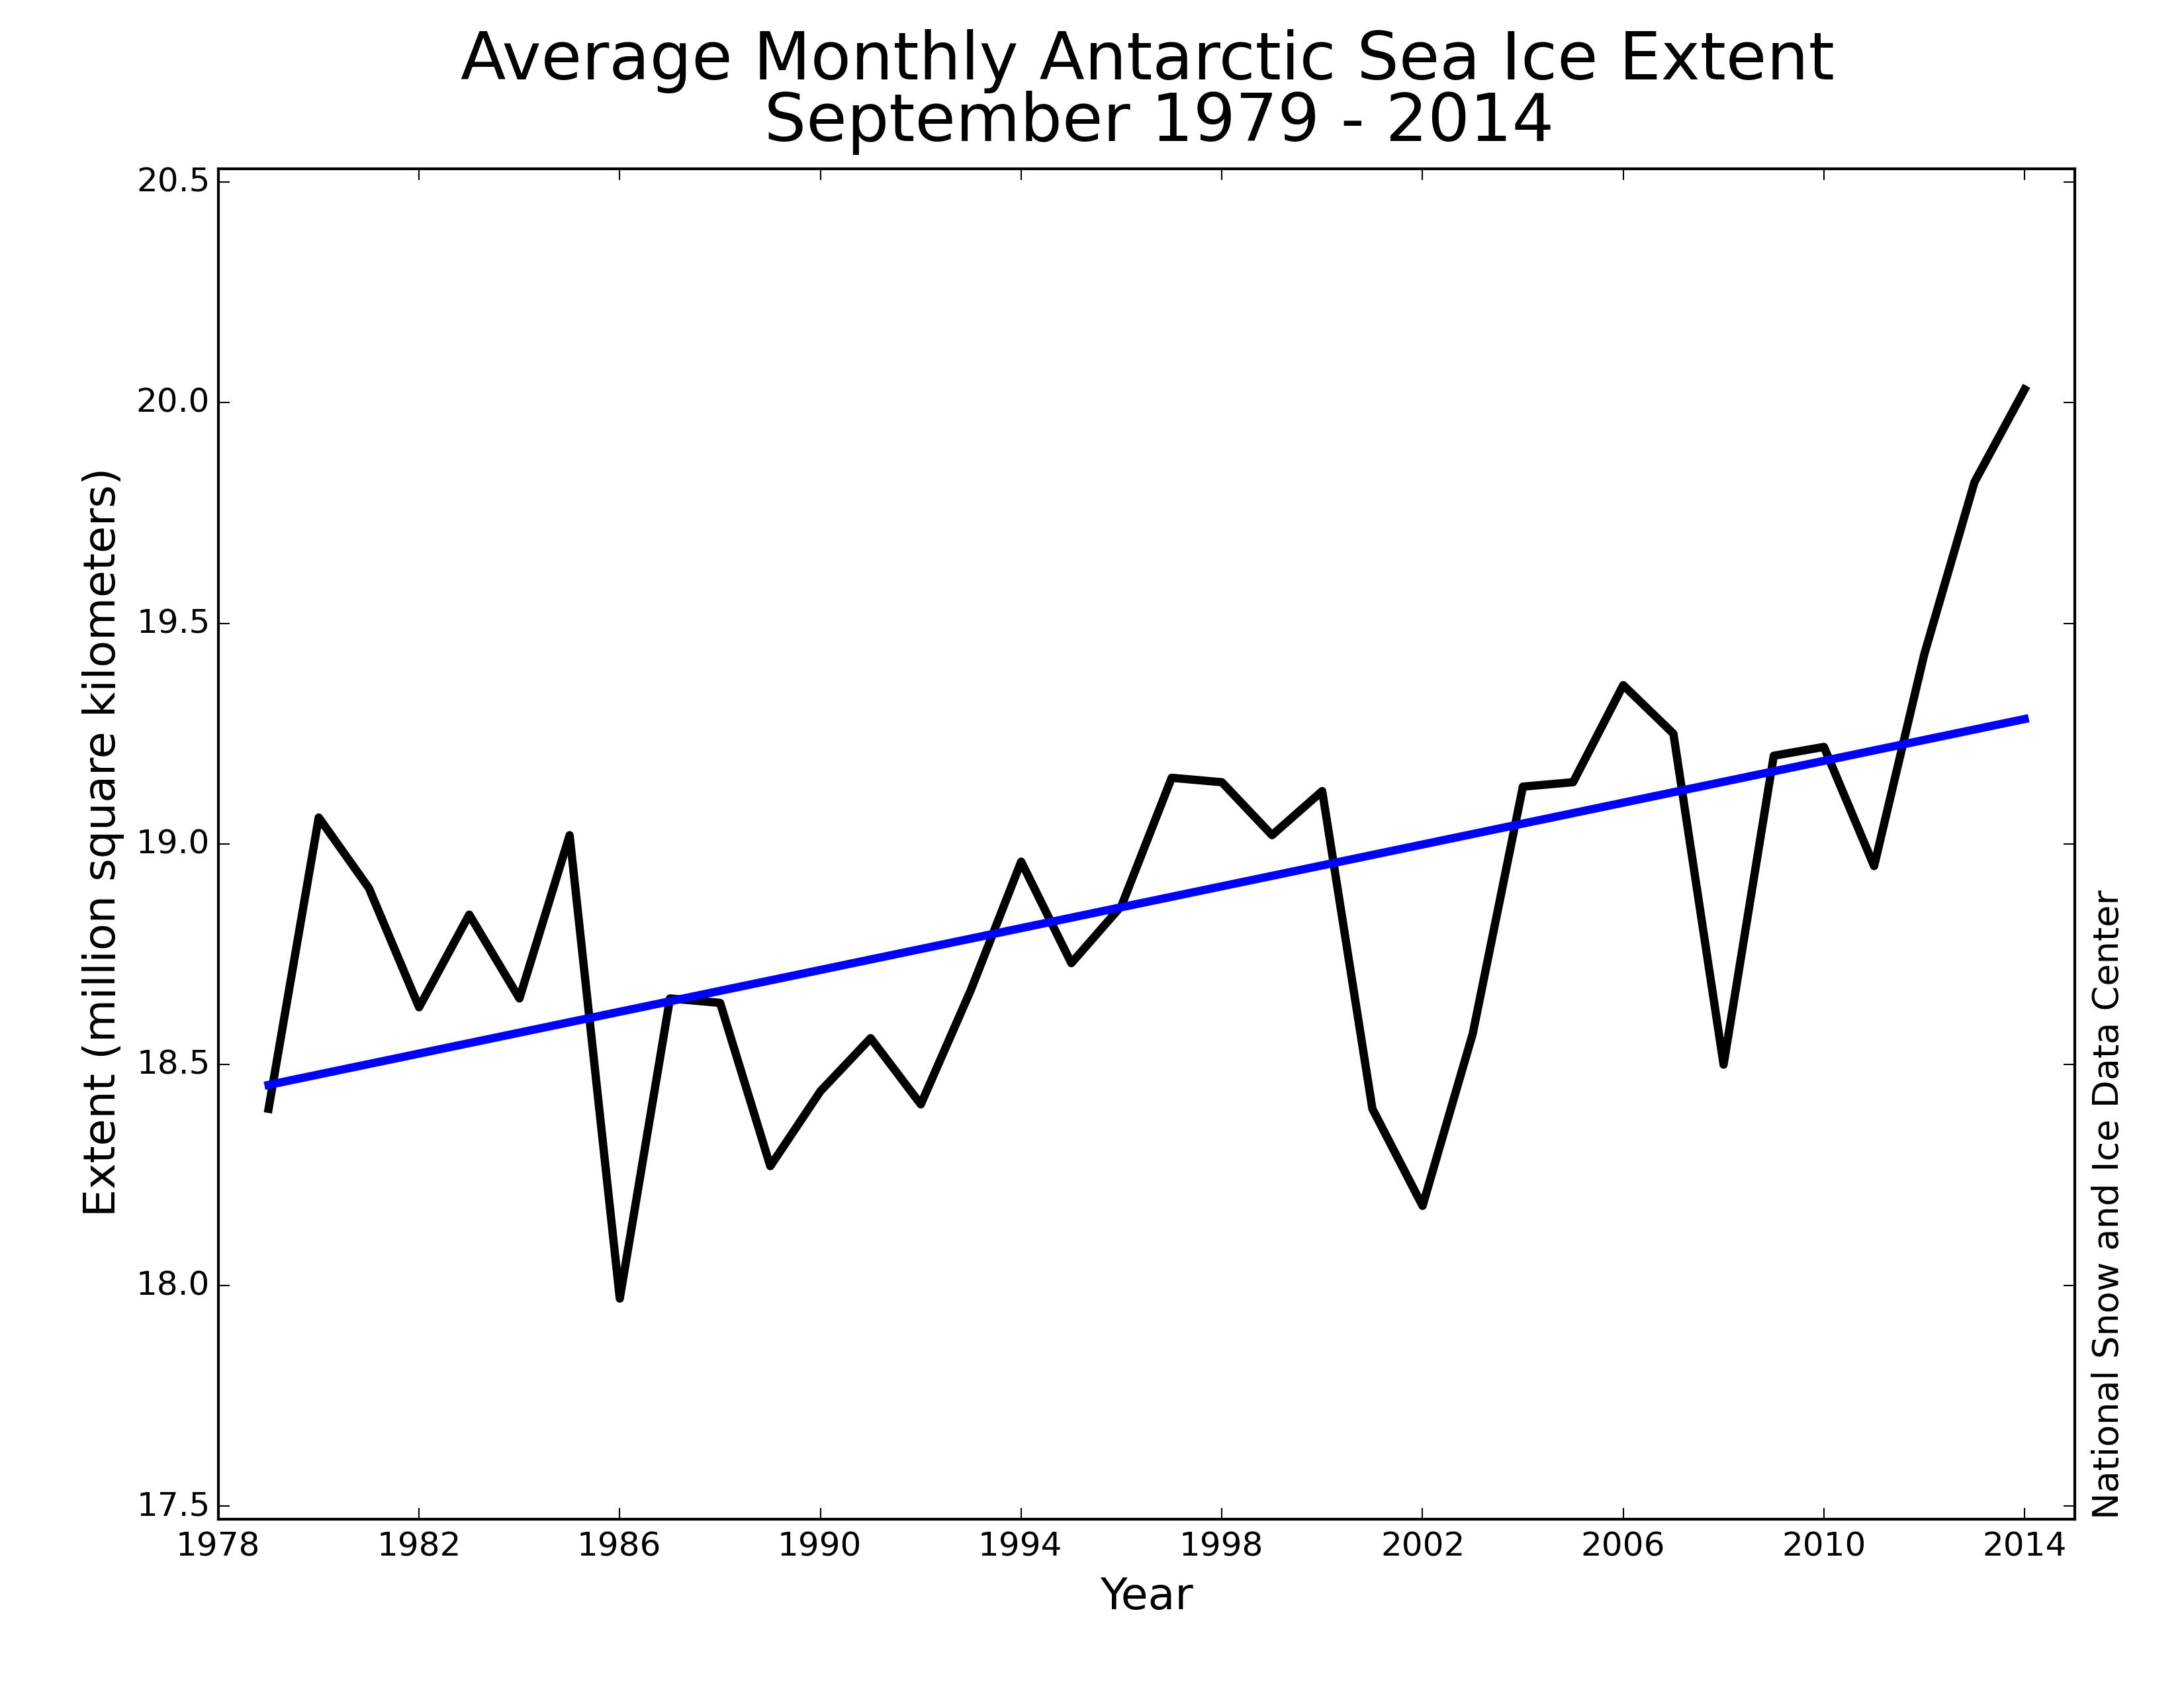
The extension of the Antarctic ice cap has reached record levels.

97% of model projections failed (111 of 114 climate models were wrong)

Since the Cambrian/Ordovician CO2 levels fluctuated naturally within a 180 ppm and 8,000 ppm range.

During the Triassic and Jurassic CO2 levels were much higher than now (now: 400 ppm – then: between 1,800 ppm and 2,000 ppm range) with no sign of runaway global warming: oceans didn’t acidify, the biosphere thrived.

The Ordovician ice age occurred with CO2 levels in the 4,000 ppm to 5,000 ppm range.

Pleistocene glaciations occurred with stable CO2 levels (around 290 ppm to 300 ppm).

The last interglacial period (Eemian) was 5.0 C warmer than now with CO2 ppm levels of about 290 ppm to 300 ppm

The Holocene Climate Optimum was at least 2.0 C warmer than the present, with CO2 ppm levels around 260-270 ppm

Temperatures decreased by about -0.5 to -0.6 C between 1940 and 1970 even though CO2 levels were increasing

“Atmospheric CO2 follows temperature changes in Antarctica with a lag of some hundreds of years” (IPCC AR4)

CO2 level changes lag behind temperature changes: 1200±700 (Andreas Indermuhle et al., Atmospheric CO2 Concentration from 60 to 20 kyr BP from the Taylor Dome ice core, Antarctica, Geophysical Research Letters, Volume 27, Number 5, March 2000).

1000 years (Lowell Stott et al., Southern Hemisphere and Deep-Sea Warming Led Deglacial Atmospheric CO2 Rise and Tropical Warming, Science, Volume 318, Issue 5849, September 2007).

800 ± 200 years (Nicolas Caillon et al., Timing of Atmospheric CO2 and Antarctic Temperature Changes Across Termination III, Science, Volume 299, Number 5613, March 2003).

600 ± 400 years (Hubertus Fischer et al., Ice core records of atmospheric CO2 around the last three glacial terminations (Science, Volume 283, Number 5408, pp. 1712-1714, March 1999).

800 ± 600 years (Eric Monnin et al., Atmospheric CO2 Concentrations over the Last Glacial Termination (Science, Volume 291. Number 5501, January 2001).

900 ± 325 years (Landais et al. Two-phase change in CO2, Antarctic temperature and global climate during Termination II, Nature Geoscience 6, 1062–1065, October 2013).

Generally low confidence that there have been discernible changes over the observed record on lack of trends in extremes, exceptions are trends seen in temperature extremes and regional precipitation (but not floods) (IPCC AR5);

Unlike in AR4, it is assessed here…there is low confidence of regional changes in the intensity of extreme extratropical cyclones (IPCC AR5);

low confidence that any reported long term increases in tropical cyclone activity are robust (IPCC AR5);

current datasets indicate no significant observed trends in global tropical cyclone frequency (IPCC AR5);

The current assessment does not support the AR4 conclusions regarding global increasing trends in droughts (IPCC AR5);

Low confidence regarding the sign of trend in the magnitude and/or frequency of floods on a global scale – there is currently no clear and widespread evidence for observed changes in flooding (IPCC AR5);

No long-term acceleration of sea level has been identified using 20th-century data alone (IPCC 2007);

It is likely that GMSL (Global Mean Sea Level) rose between 1920 and 1950 at a rate comparable to that observed between 1993 and 2010 (IPCC AR5);

Antarctic sea ice extent is also projected to decrease in the 21st century (IPCC AR4)

Most models simulate a small decreasing trend in Antarctic sea ice extent, in contrast to the small increasing trend in observations… There is low confidence in the scientific understanding of the small observed increase in Antarctic sea ice extent (IPCC AR5)

The recent observed positive trends in total Antarctic sea ice extent are at odds with the expectation of melting sea ice in a warming world. More problematic yet, climate models indicate that sea ice should decrease around Antarctica in response to both increasing greenhouse gases and stratospheric ozone depletion.

Lorenzo M. Polvani, Karen L. Smith, Can natural variability explain observed Antarctic sea ice trends? New modeling evidence from CMIP5, Geophysical Research Letters, Volume 40, Issue 12, pages 3195–3199, 28 June 2013

For the Southern Ocean as a whole, sea surface temperature has decreased by approximately 0.6°C in December-February (0.4°C in the annual mean) while Antarctic sea ice cover has increased by approximately 9% in December-February (12% in the annual mean) during 1979-2011.

Fan, T., C. Deser, and D. P. Schneider (2014), Recent Antarctic sea ice trends in the context of Southern Ocean surface climate variations since 1950, Geophys. Res. Lett., 41, 2419–2426

[O]ur spatial analysis of Antarctic meteorological data demonstrates a net cooling on the Antarctic continent between 1966 and 2000, particularly during summer and autumn. The McMurdo Dry Valleys have cooled by 0.7 °C per decade between 1986 and 2000, with similar pronounced seasonal trends.

Peter T. Doran et al., Antarctic climate cooling and terrestrial ecosystem response, Nature, 415, 517-520 (31 January 2002)

Jay H. Zwally et al., Mass Gains of the Antarctic Ice Sheet Exceed Losses, NASA technical report, Jul 14, 2012.

Frezzotti et a. A synthesis of the Antarctic surface mass balance during the last 800 yr, The Cryosphere, 7, 303–319, 2013.

Curt H. Davis et al. Snowfall-Driven Growth in East Antarctic Ice Sheet Mitigates Recent Sea-Level Rise, Science 24 June 2005:
Vol. 308 no. 5730 pp. 1898-1901.

Gong, Y., Cornford, S. L., and Payne, A. J.: Modelling the response of the Lambert Glacier–Amery Ice Shelf system, East Antarctica, to uncertain climate forcing over the 21st and 22nd centuries, The Cryosphere, 8, 1057-1068.

Elizabeth R. Thomas, Gareth J. Marshall, Joseph R. McConnell, A doubling in snow accumulation in the western Antarctic, Peninsula since 1850, Geophysical Research Letters, Volume 35, Issue 1, January 2008.

Antarctica and the Southern Ocean have been *cooling* and the sea ice is trending upwards:

http://nsidc.org/arcticseaicenews/files/2014/10/monthly_ice_SH_09.png

Growing Antarctic Ice Sheets May Have Sparked Ice Age, Live Science, December 04, 2014

Solheim et al., The long sunspot cycle 23 predicts a significant temperature decrease in cycle 24, Journal of Atmospheric and Solar-Terrestrial Physics, Volume 80, May 2012, Pages 267–284

Northern Europe and the coming climate refugees crisis

All this has happened before, and all of it will happen again: the imminent abrupt glaciaton

hurricane

What is happening is very similar to the time 115,000 years ago, when the last glaciation started. It is difficult to comprehend, but it is really so: The last glacial was accompanied by the increase of a really averaged global mean surface temperature, alias global warming.

What happened then was that the shifting sun warmed the tropics and cooled the Arctic and Antarctic. Because the tropics are so much larger than the poles, the area-weighted global mean temperature was increasing. But also increasing was the temperature difference between the oceans and the poles, the basic condition of polar ice growth. Believe it or not, the last glacial started with ‘global warming!

So, as more water vapor’s carried to the poles the southern icecap calves and thickens, the extreme center of the northern pole gradually becomes ice-free and the lower latitudes experience heavier snowfalls that gradually start migrating towards the south.

That’s exactly what’s happening now.

George Kukla, paleoclimatologist

http://web.archive.org/web/20140704220151/http://www.sciences360.com/index.php/prepare-for-new-ice-age-now-says-top-paleoclimatologist-5899/

Not only were they [mammoths] flash frozen as you describe, but they were also asphyxiated, many being found with erect penises consistent with DEATH BY ASPHYXIATION. Their lungs were filled with sand and dirt and they were sitting on their hind legs with protruding tongues as though they were gasping for air as they died.

Something brought VACUUM and COLD right down to the SURFACE of the Earth, and as the air was sucked out from the Mammoth habitat it filled with debris which entered the lungs of not just mammoths but other creatures found the same way. Then everything was covered with frozen muck and remained until the present times. Something cataclysmic happened IN AN INSTANT.

http://iceagenow.info/2015/07/researchers-confirm-that-cold-weather-killed-the-mammoths-but-article-tries-to-blame-global-warming/#comment-315432

I know that air pressure goes down as a storm approaches. Super cells have both updrafts and downdrafts. Super cells can produce up to grapefruit-sized hail. What about a storm so powerful that it literally sucks all of the air out of the local atmosphere as it advances and then flash freezes everything with super cold outflow as it passes? And, just for good measure it deposits a heavy layer of frozen muck over everything before it is gone,, dragging a severe, permanent cold front behind in its wake, leaving cold that persists for a millennium. But, what could cause anything like that? Pole reversal?

http://iceagenow.info/2015/07/what-killed-the-mammoths-heatstroke-or-frostbite/#comment-315442

Earth’s climate works like a rubber band being stretched and suddenly released. For years, eons even, the stresses slowly build as the chemistry of the air changes. And then, in a matter of a few years or even a few months, there is a shift so vast that we can scarcely begin to imagine it.

Earth, it seems, has a powerful regulatory mechanism built into its climate. Heat increases to a certain point, and then the whole system breaks down. Cold air comes roaring down from the north, flooding the previously overheated Northern Hemisphere.

Suddenly, a new era of cold weather begins. We know, generally, how this happens. But not even science has as yet faced the fact that this change must be accompanied by an absolutely massive release of energy, as earth’s climate strives to reorganize itself.

In other words, this great shift of climate is almost certainly accompanied by a great storm or series of storms, a weather upheaval outside of contemporary human experience. We believe that it has happened before, and that traces of what we are calling the superstorm exist in the fossil record. We believe that it comes on suddenly and that it is so destructive that it has the potential to end our civilization.

These are sensational claims, but we can prove that nature pulls the trigger suddenly and, therefore, that the rebalancing of the climate that follows must also be very sudden and involve titanic energies. This suggests that our present situation may be extremely perilous.

Over the past three million years the earth has been locked in an unusually harsh climate system. During this period, our climate has flipped from warm to cold conditions and back again many times. Again and again, earth has warmed up, getting hotter and hotter until — very suddenly — the glaciers have come back and entombed a quarter of the planet in ice for upwards of a hundred thousand years.

Sometimes, the cooling event has not resulted in a long-term buildup of ice. Sometimes, as happened around 8,000 B.C., sudden cooling has not led to the return of the ice, but has only interrupted the warming process for a short time.

All of the factors that have caused sudden climate change in the past are lining up right now. This change, which we will show is part of a vast natural cycle, has been sped up this time by human activity. When the change comes, it is likely to be much more violent than ever before, and we will offer evidence from recent and unexpected climatological data that indicates why this would be so.

If the storm — as the last one appears to have done — hit in summer, the ice would probably melt. It is possible that this happened the last time and, as we shall see, was recorded in myth all over the world.

If the storm took place in the fall or winter, then the ice could conceivably compress so much in the next few months and reflect back so much heat and light that the next summer simply would not be warm enough to melt it. The winter that followed would be the coldest in history.

The ultimate and ironic effect of global warming would have become clear to the survivors: a new ice age would have begun.

http://www.bibliotecapleyades.net/ciencia/esp_ciencia_tsunami17a.htm#The%20Coming%20Global%20Superstorm